

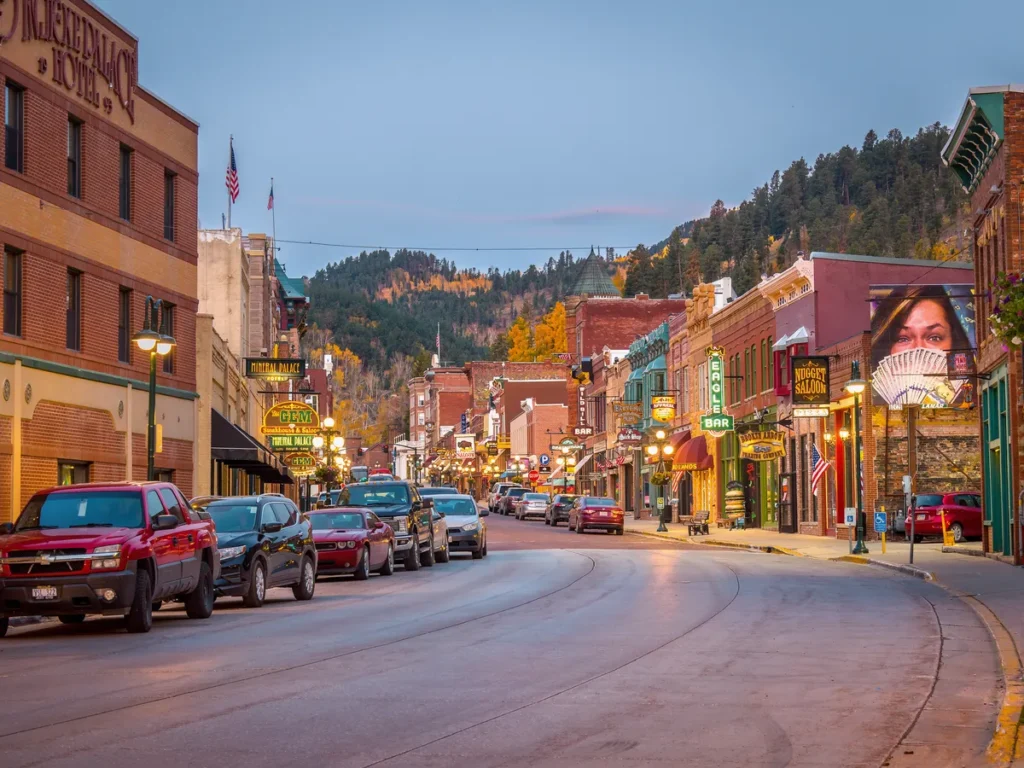
Late September in Deadwood is a quiet stretch of the calendar. The Sturgis motorcycle crowds have been gone for weeks, the aspens in the northern Black Hills are turning, and the gaming floors along Main Street are working on weekend drive-in traffic rather than peak-summer volume. The month still printed a double-digit increase, and the state release that confirmed it came with exactly zero words of explanation attached.
Deadwood’s September revenue, by the numbers
Deadwood casino revenue reached $16.9 million in September, up 11% year over year, according to South Dakota Department of Revenue figures reported by CDC Gaming. Slots produced $15.3 million of that, up 11.1%, while table games contributed $1.4 million, up 10.5%.
Two points of housekeeping before anyone builds a thesis on it. First, these figures are gaming win, meaning what the casinos kept after paying out winners, not the amount players wagered. Second, the report does not publish last September’s dollar total. An 11% increase on $16.9 million implies something in the region of $15.2 million a year earlier, but that is my arithmetic off a rounded percentage, not a published number, and it should be treated as such.
The detail underneath the headline is where the month gets interesting.
| Category | September revenue | Year-over-year change |
|---|---|---|
| Slots (total) | $15.3 million | +11.1% |
| One-cent slots | $13.1 million | +13% |
| $1 slots | $803,164 | −29.9% |
| City slots | $595,264 | Not reported |
| 25-cent slots | $403,833 | Not reported |
| Table games (total) | $1.4 million | +10.5% |
| Blackjack | $598,084 | +19.3% |
| House-banked poker | $576,336 | Not reported |
| Player-banked poker | $114,875 | Not reported |
What the data supports, and what it doesn’t
The tourism explanation is inference, not reporting
The Department of Revenue release credits nothing for the increase. It is a tabulation, not an analysis, and that distinction matters more than the 11% does. Fall travel through the Black Hills is the obvious candidate for a September lift in a market whose customer base arrives by car, and Deadwood’s economy is openly built around visitation. But “obvious candidate” is not the same as “cited driver,” and nobody reading this should accept a number attached to the tourism share of that growth, because no such number exists in the source.
What would settle it is visitation data for the same month alongside the multi-year monthly revenue series. That comparison is available in principle from state sources. It is not in this release, and I am not going to estimate it.
Penny slots did the work at Deadwood casinos
One-cent slots generated $13.1 million, up 13%, which is roughly 86% of all slot revenue and about 78% of the market’s total win. That is the engine. Everything else at Deadwood casinos is a side note by comparison, and treating the categories as equally informative is the fastest way to misread the month.
Consider the statewide denomination figures in the same report. Across all game types in South Dakota, $25 slots posted the largest year-over-year increase at 136.6%, with $5 slots up 74.8%. Roulette fell 49.7%, 50-cent slots fell 33.6%, and $1 slots fell 29.9%. I would ignore the 136.6% almost entirely. High-denomination machines and single table games sit on small revenue bases, where a handful of players or a short run of bad hold swings the percentage violently. A 136.6% gain on a tiny base tells you less than a 13% gain on $13.1 million.
Note too that $1 slots appear in both lists: a leading revenue generator at $803,164 and simultaneously down 29.9%. That is a category shrinking from a decent base while the penny segment expands, which reads like a mix shift in how Deadwood’s floors are configured and played rather than a demand story. Blackjack up 19.3% against roulette down 49.7% in the same month points the same direction: at this scale, individual game lines are noise around a stable low-denomination core.
South Dakota gaming revenue beyond a single month
The release gives no year-to-date total and no statement on whether this has been a growth year for South Dakota gaming revenue overall. So the honest answer to whether September extends a trend or interrupts one is that this report cannot tell you. Anyone presenting a year-to-date figure here is pulling it from a different document or from thin air.
Context worth holding onto: commercial casino gaming in South Dakota is confined to Deadwood, and the state’s tribal casinos operate separately under their own compacts, so the Department of Revenue’s Deadwood tabulation is not a proxy for all gambling in South Dakota. A month at $16.9 million annualizes to roughly $200 million if it held flat, which it will not, and which places Deadwood somewhere near the statistical margin of a large commercial state.
Why regional casino market trends deserve their own read
Small drive-in markets measure something Las Vegas and Atlantic City cannot. Deadwood has no convention calendar, no international arrivals, no air-lift variable and no major sports anchor. Its revenue is a fairly direct readout of how much discretionary money households within driving distance are willing to put through a gaming floor, filtered through weather and the travel season.
That makes regional casino market trends a cleaner signal on local demand and a worse signal on anything else. An 11% month in Deadwood tells you that drive-in demand in one corner of the upper Midwest held up through September, with the penny-slot segment, generally the most value-conscious end of the floor, leading the increase. It does not tell you about national consumer confidence, and it does not tell you what happened in Pennsylvania or Louisiana.
What one month can and can’t say about US gaming revenue
One market’s monthly print is not evidence of a national trend, and the mechanics of these reports make that doubly true at Deadwood’s size. Monthly figures swing on calendar composition, on the number of weekend days in the period, on weather over a holiday weekend, and on hold variance. With table games at $1.4 million for the whole market, a couple of unusual sessions can move the table-game percentage by double digits in either direction.
Where regional numbers earn their keep is in aggregate and across time. If several similar markets report mid-single to low-double-digit growth in the same period and national figures agree, that is a signal. If Deadwood runs hot while comparable regional gambling destinations run flat, the explanation is probably local. One month, from one city, in one state, is a data point.
The test to watch is not October’s headline. It is whether the low-denomination base keeps growing in a month with no travel tailwind at all, somewhere in the dead of a Black Hills winter, when a double-digit gain would mean something quite different from what it means in September.